
… or Fish (29.1.) vs. Sugar (30.1.) in isotope language:
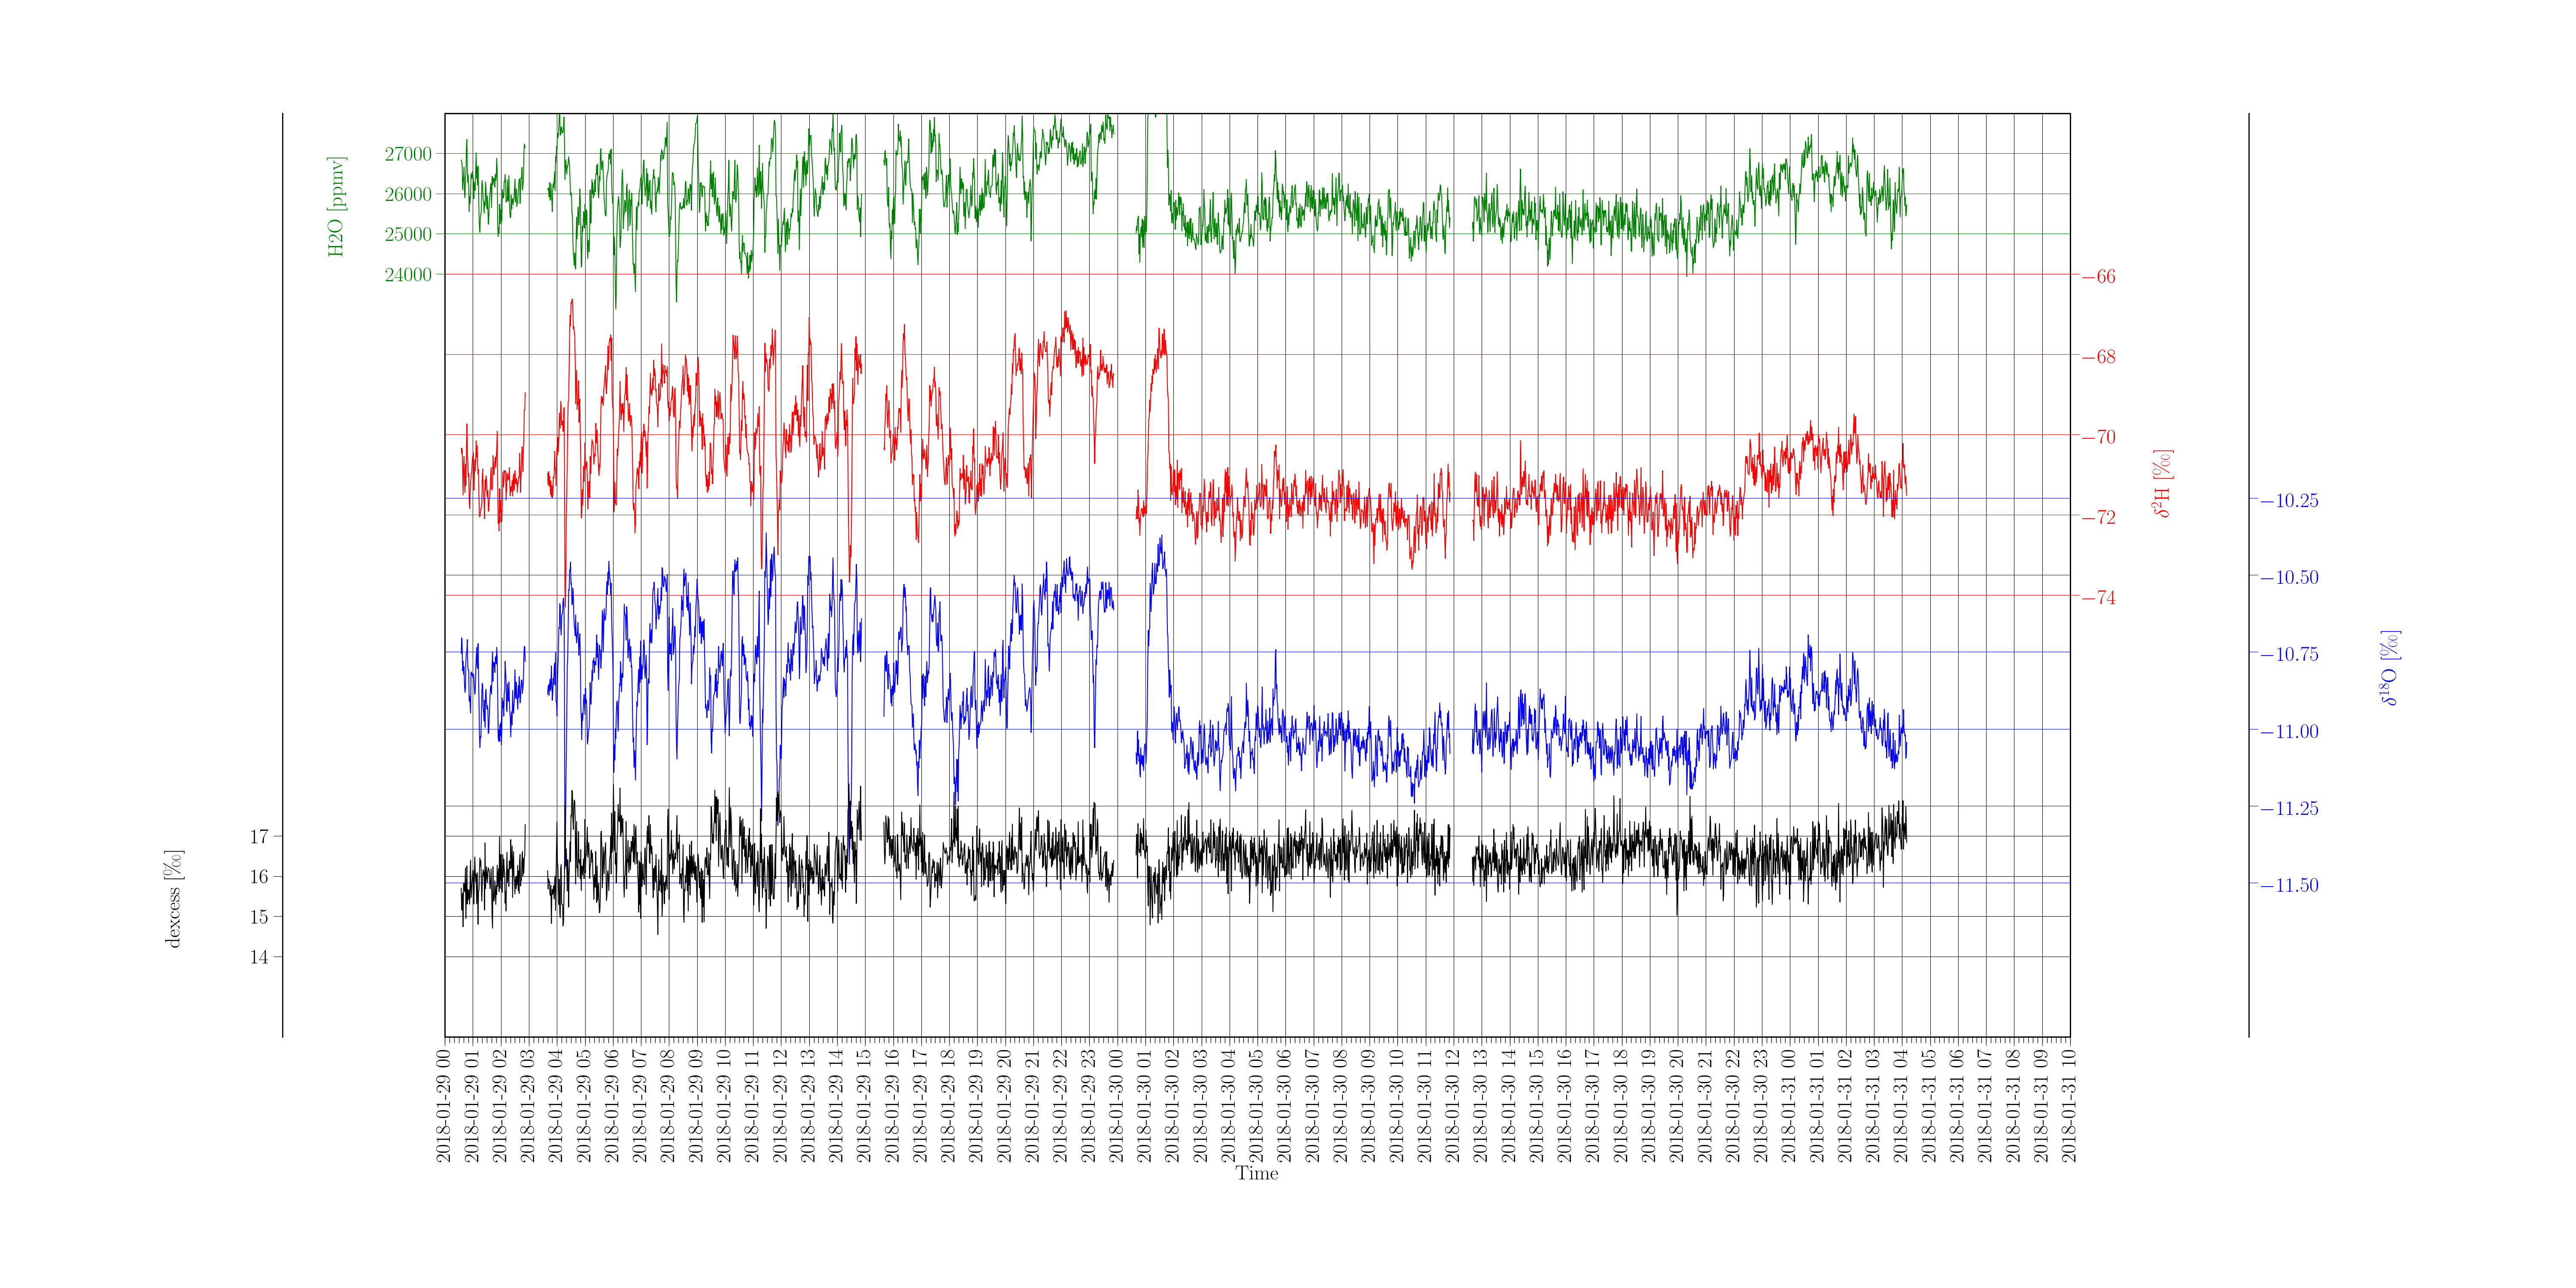
The change in the variability regimes of the isotope signals from one day to the next is striking! The lower delta values and marginally higher dexcess on the 30.1. are probably due to the lower relative humidity, slightly dryer boundary layer and enhanced surface fluxes. It is also interesting to note the inverse delta-temperature relation here. Temperatures of <26°C on 29.1. go along with on average higher delta values than on 30.1. when temperatures of >26°C were measured.


