The Raman lidar operates at three different wavelengths (1064, 532 and 355 nm) and measures (attenuated) backscatter from particles, being either aerosols or clouds, up to a height of 15 km. From these data we can have a good idea where cloud layers and aerosol layers are located. Data from the Raman can also be used to derive water vapor mixing ratio’s during nighttime only.
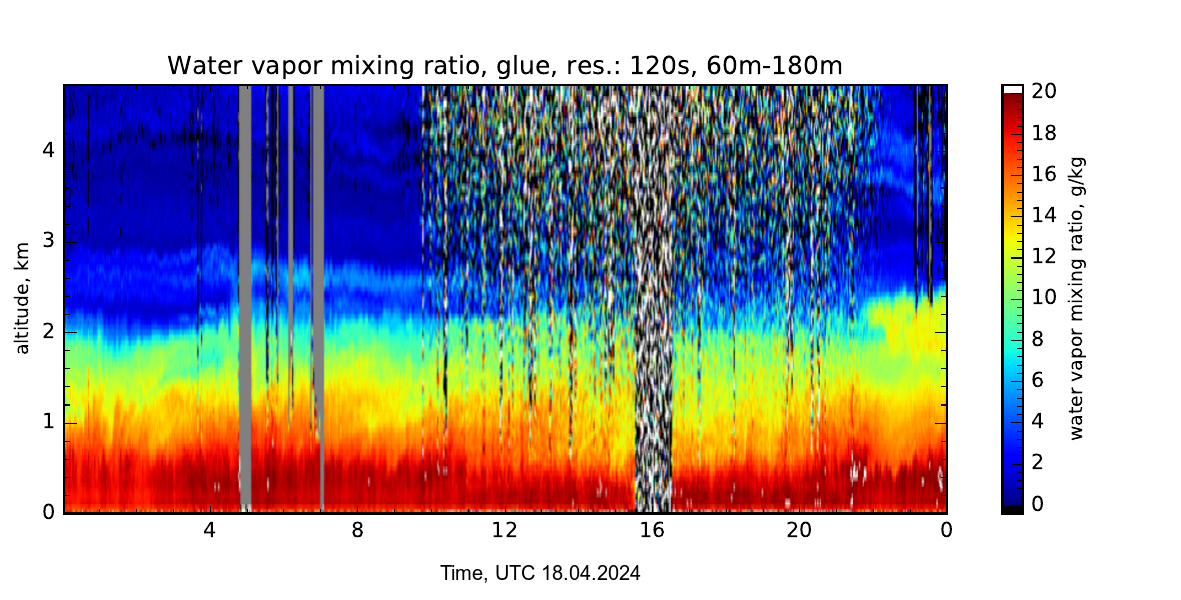
Many thanks to Ilya who sent me the figures you find below. These figures show the attenuated backscatter signal in ln(pr^2) from the Raman lidar at a 1024 nm wavelength (here plotted are profiles up to 6 km for data received with the near range telescope), as well as the water vapor mixing ratio’s in g/kg. The two days are Friday the 12th and Sunday the 14th. As I wrote in an earlier post, the atmosphere at levels near 800 hPa has been humidifying over the last few days. We could see this in the sounding data, but clearly this is evident from the differences in water vapor near 2 – 3 km in the Raman profiles.
Clouds show up in the backscatter profiles as red to white (out of color scale) returns. Above a cloud layer, the signal is often much attenuated, which you can see from the many black vertical lines showing up at heights above 1 km. The yellow to green and turquoise colors indicate what I interpret as aerosol backscatter, where the sharp change from turquoise to dark blue seems to indicate the top of the boundary layer. Some of these patterns (the variation and extent of these layers) coincide well with the water vapor. For instance, see the ‘plume’ of humidity values near 20 g/kg extending to above 2 km starting at 7 UTC on the 12th of November. The same ‘plume’ can be seen in the backscatter profiles.
From the 12th to the 14th you can also note a general decrease in the backscatter signal, on the 14th much less returns show up as yellow/red, but as turquoise. I have been looking at these plots today with Greg Roberts who measures CCN spectra aboard ACTOS (also read about this on the blog). He shows a very clear trend of having much lower concentrations of CCN yesterday and today (about 100-150 per cc) as compared to a few days ago, where maxima were near 400 per cc. The Raman will be able to provide very nice vertical profiles that can be compared to his data.
It is great to see how nicely some of these structures show up in the Raman profiles and how different the two days look like! (Ilya may have lots of things to add and hopefully corrects some of my misinterpretations).





2 Responses to Raman lidar measurements